What You'll Learn
After using this calculator you will be able to:
What is a 3D Graph Calculator?
A 3D Graph Calculator is an interactive mathematical tool that visualizes equations, functions, surfaces, and geometric objects in three-dimensional space using x, y, and z coordinates. It is widely used in engineering, mathematics, computer graphics, physics, architecture, and scientific research.
A 3D Graph Calculator is an interactive mathematical visualization tool that converts equations into three-dimensional graphs, allowing users to explore functions, surfaces, and geometric objects in real time. Unlike a traditional two-dimensional graphing calculator that displays relationships between only the X and Y axes, a 3D graphing calculator introduces a third dimension (the Z-axis) making it possible to visualize complex mathematical surfaces, engineering models, scientific data, and multivariable functions.
Instead of reading equations as abstract mathematical expressions, users can instantly transform them into interactive models that can be rotated, zoomed, sliced, and examined from every angle. This visual approach makes complex concepts significantly easier to understand while helping students, educators, engineers, architects, researchers, and scientists analyze mathematical relationships that cannot be represented on a flat graph.
Modern online 3D graph calculators operate entirely within a web browser, eliminating the need to install expensive mathematical software like MATLAB or Mathematica. Users can simply enter an equation, choose visualization settings, and immediately interact with the generated surface — no account or installation needed.
Our 3D Graph Calculator supports a wide range of mathematical equations including explicit functions, implicit surfaces, engineering models, geometric solids, and advanced multivariable functions. Whether you are studying calculus, solving engineering problems, visualizing physical phenomena, or teaching mathematics, the calculator provides an intuitive environment for exploring three-dimensional mathematics.
Why Use a 3D Graph Calculator?
Many mathematical concepts become difficult to understand when viewed only as equations. Three-dimensional visualization allows you to see how variables interact, how surfaces change, and how mathematical relationships behave across space.
A 3D graphing calculator helps you:
- Visualize complex mathematical surfaces instantly
- Explore multivariable functions interactively
- Understand calculus concepts more easily
- Analyze engineering and architectural models
- Compare multiple equations simultaneously
- Investigate intersections between surfaces
- Demonstrate mathematical concepts during teaching
- Improve problem-solving through visualization
- Build intuition for higher-dimensional mathematics
Instead of imagining how an equation behaves, you can observe its complete structure in real time. Students who pair this tool with a Standard Deviation Calculator or statistics tools gain a fuller picture of how mathematical distributions look as 3D surfaces.
How Does a 3D Graph Calculator Work?
A 3D graph calculator converts mathematical equations into graphical surfaces by evaluating thousands of coordinate points across three-dimensional space. This is similar in concept to how the Geometry Calculator evaluates 2D shapes, but extended into three dimensions.
For every point within the selected coordinate range, the calculator computes the corresponding values and generates a continuous surface composed of thousands of interconnected polygons. Modern rendering technologies such as WebGL then display these polygons as smooth interactive models inside your browser.
The visualization process generally follows these steps:
- Read the mathematical equation entered by the user.
- Generate coordinate values across the selected X and Y ranges.
- Calculate the corresponding Z value for every coordinate pair.
- Build a polygon mesh representing the mathematical surface.
- Apply lighting, shading, and color gradients.
- Render the model using GPU acceleration.
- Allow users to rotate, zoom, pan, and inspect the surface interactively.
This entire process happens almost instantly, making it possible to explore even complex mathematical functions in real time.
Understanding the Three-Dimensional Coordinate System
A three-dimensional graph uses three perpendicular axes to describe the position of every point in space.
X-Axis
The X-axis represents horizontal movement from left to right. Positive values extend to the right, while negative values extend to the left.
Y-Axis
The Y-axis represents movement from front to back (or depth depending on the viewing angle). Together, the X and Y axes define the base plane where functions are evaluated.
Z-Axis
The Z-axis represents height. Every calculated value of a function determines how high or low the surface rises above the X-Y plane.
This additional dimension allows mathematical surfaces to represent relationships that cannot be visualized using ordinary two-dimensional graphs. If you need to solve a system of linear equations before plotting, our Linear Equation Solver can help you find the coordinate values first.
Explicit Functions
One of the most common graph types supported by a 3D Graph Calculator is the explicit function. An explicit function defines the height of a surface directly as a function of two variables.
General form:
z = f(x, y)
Examples include:
- z = x² + y²
- z = sin(x) × cos(y)
- z = √(x² + y²)
- z = e^(-(x²+y²))
Because every coordinate pair (x, y) produces exactly one corresponding value of z, explicit functions generate smooth continuous surfaces that are ideal for studying calculus, optimization, physics, and engineering.
Implicit Surfaces
Unlike explicit functions, implicit equations define relationships among all three variables simultaneously.
General form:
F(x, y, z) = 0
Examples include:
- x² + y² + z² = 16
- x² + y² − z² = 4
- x²/16 + y²/9 + z²/4 = 1
These equations describe complete three-dimensional objects rather than simple surfaces. Implicit surfaces are widely used in:
- Geometry
- Computer graphics
- Mechanical engineering
- Medical imaging
- Scientific visualization
- Physics simulations
Specialized rendering algorithms convert these equations into interactive 3D models.
Try These Example Equations
You can copy and paste these equations directly into the 3D Graph Calculator to see how they render.
Paraboloid
z = x² + y²Wave
z = sin(x) cos(y)Ripple
z = sin(√(x²+y²))Cone
z = √(x²+y²)Sphere
x²+y²+z²=16Hyperboloid
x²+y²−z²=4Gaussian
z = exp(-(x²+y²)/8)Monkey Saddle
z = x³−3xy²Why Choose NepaCalc 3D Graph Calculator?
- Browser-based: Runs entirely in your web browser.
- No installation: No heavy software downloads required.
- Free: Completely free to use.
- GPU accelerated: Uses WebGL for high-performance rendering.
- Multiple equations: Plot multiple functions simultaneously.
- Variable sliders: Interactive parameters for dynamic exploration.
- Cross-section slicing: Analyze internal structures easily.
- Interactive rotation: Drag and zoom intuitively.
- Engineering presets: Built-in formulas for immediate use.
- High-resolution rendering: Crisp and clear mathematical visualization.
- Mobile friendly: Works seamlessly on smartphones and tablets.
- Fast WebGL rendering: Real-time feedback and smooth animations.
Common Mistakes When Graphing 3D Functions
- Incorrect parentheses: Failing to balance brackets properly alters the mathematical order of operations.
- Invalid equation syntax: Using symbols like 'x' for multiplication instead of '*' can cause parsing errors.
- Division by zero: Functions that divide by zero create undefined asymptotes that may render incorrectly.
- Poor graph ranges: Setting domain bounds too large or too small can hide critical surface features.
- Confusing radians and degrees: Trigonometric functions typically expect radians by default.
- Mixing implicit and explicit equations: Ensure the calculator is set to the correct mode for the equation type.
- Plotting outside valid domains: Taking the square root of negative numbers without complex support causes missing surfaces.
Educational Applications
- High School: Introduce students to 3D geometry and spatial reasoning.
- AP Calculus: Visualize volumes of revolution and surface areas.
- IB Mathematics: Support internal assessments and exploration projects.
- University Mathematics: Master multivariable calculus, partial derivatives, and multiple integrals.
- Engineering Courses: Model stress distributions and mechanical components.
- Research: Analyze complex mathematical models and experimental data.
- Classroom Demonstrations: Teachers can use interactive graphs to explain abstract concepts.
Engineering Applications
- Structural Analysis: Visualize load distributions and deformation across surfaces.
- Fluid Mechanics: Model pressure gradients, flow velocity profiles, and turbulence.
- Heat Transfer: Map temperature distributions across thermal conductors.
- Signal Processing: Plot frequency spectra and 2D Fourier transforms.
- Mechanical Design: Model gear profiles, cams, and complex mechanical surfaces.
- CAD Modeling: Develop and test mathematical definitions of surfaces before drafting.
- Numerical Analysis: Visualize errors and convergence in computational methods.
- Finite Element Analysis: Display boundary conditions and stress contours.
Recommended Learning Path
Follow this progression to master mathematical visualization:
Common Problems You Can Solve
This calculator is designed to help users with a variety of mathematical and engineering challenges:
- Plot 3D equations: See the exact shape of any valid mathematical function.
- Visualize multivariable functions: Easily understand functions that depend on both x and y.
- Understand calculus surfaces: Master gradients, partial derivatives, and multiple integrals visually.
- Compare mathematical functions: Overlay multiple equations to see how they differ.
- Study optimization surfaces: Find saddle points, local maxima, and minima for machine learning models.
- Visualize Gaussian distributions: Plot bivariate normal distributions in statistics.
- Plot saddle surfaces: Easily visualize hyperbolic paraboloids.
- Explore engineering geometry: Model physical properties like stress and fluid flow mathematically.
- Learn coordinate systems: Gain an intuitive grasp of the Cartesian, cylindrical, and spherical coordinates.
- Understand implicit equations: See complete objects like spheres and toruses defined by a single relationship.
Related Mathematics Topics
Cartesian Coordinates
The fundamental 3D (x, y, z) coordinate system used for spatial graphing.
Multivariable Calculus
The extension of calculus to functions of multiple variables, relying heavily on 3D visualization.
Surface Plotting
The technique of rendering continuous 3D surfaces from mathematical equations.
Implicit Equations
Equations defining relationships between variables (like F(x,y,z)=0) without explicit solved forms.
Parametric Surfaces
Surfaces defined by parameters u and v, useful in computer graphics and CAD.
Differential Geometry
The study of smooth shapes, curvature, and spaces using calculus.
Vector Calculus
Analysis of vector fields, used extensively in physics and engineering.
Optimization
Finding the best solution (maxima/minima), crucial for machine learning and economics.
Topology
The study of spatial properties that are preserved under continuous deformations.
Also Known As
Users often search for our tool using different terminology depending on their region and field of study. You may hear it referred to as a:
- 3D Graph Calculator
- 3D Grapher
- Online 3D Plotter
- 3D Surface Grapher
- 3D Equation Grapher
- 3D Function Grapher
- Online 3D Graphing Calculator
- Multivariable Grapher
- 3D Plot Calculator
- 3D Surface Plotter
Who Uses a 3D Graph Calculator?
Interactive three-dimensional graphing tools are used across many academic and professional disciplines.
Students
Students use 3D graph calculators to understand multivariable calculus, geometry, algebra, and mathematical visualization.
Teachers
Educators demonstrate difficult concepts visually, helping students understand surfaces, gradients, intersections, and mathematical models more effectively.
Engineers
Mechanical, civil, structural, and aerospace engineers (Engineering Calculator Hub) use three-dimensional graphs to model physical systems, optimize structures, and analyze mathematical relationships.
Researchers
Physics researchers and scientists visualize mathematical models, simulation outputs, and experimental datasets using interactive three-dimensional graphs.
Architects & Designers
Architecture students and CAD Designers explore curved surfaces, shell structures, and geometric forms before translating concepts into real-world designs.
Data Scientists & ML
Machine learning engineers and data scientists use surface plots to visualize optimization functions, probability distributions, and multidimensional datasets.
Educators
Mathematics teachers and university professors use it to interactively demonstrate complex topology and surface concepts in the classroom.
Specialized Engineers
Robotics engineers and aerospace engineers rely on 3D visualizations for kinematics and fluid dynamics modeling.
Why Interactive Visualization Matters
Reading an equation provides numerical information, but visualizing it provides understanding. Interactive graphing enables users to:
- Rotate models from every direction
- Zoom into important regions
- Inspect peaks and valleys
- Compare multiple surfaces
- Understand symmetry
- Explore curvature
- Identify intersections
- Observe mathematical behavior dynamically
For many advanced mathematical topics, visualization significantly reduces the time required to understand abstract concepts.
A modern 3D Graph Calculator transforms equations into intuitive visual models, making mathematics more accessible, engaging, and practical for learners and professionals alike.
How to Use the 3D Graph Calculator
What is a 3D Graphing Calculator? A 3D graphing calculator is an interactive mathematical software tool designed to plot equations and multivariable functions in three dimensions (X, Y, and Z). It allows users to visualize complex mathematical concepts, render geometric surfaces, and interactively rotate models to analyze relationships across multiple axes simultaneously.
The NepaCalc 3D Graph Calculator is designed to make mathematical visualization simple, whether you are plotting your first surface or analyzing advanced engineering equations. Follow the steps below to generate accurate three-dimensional graphs directly in your browser.
Step 1 — Enter Your Mathematical Equation
Begin by typing your equation into the equation input field. The calculator supports a wide variety of mathematical expressions, including explicit functions, implicit equations, engineering surfaces, trigonometric, exponential, and polynomial surfaces.
Example equations:
As you edit your equation, the graph updates immediately, allowing you to experiment with different mathematical models without refreshing the page.
Step 2 — Select a Built-in Preset
If you do not want to type equations manually, choose one of the predefined mathematical surfaces from the preset library. Current presets include:
Step 3 — Adjust Variables Using Interactive Sliders
Many mathematical equations contain adjustable parameters. For example: z = a × sin(x): changing the value of a instantly modifies the graph without rewriting the equation. Variable sliders let you investigate amplitude, frequency, scaling, stretching, compression, translation, and engineering constants interactively.
Step 4 — Rotate the Graph
Simply click and drag the graph to rotate the camera around the object. Viewing a surface from multiple angles helps reveal peaks, valleys, symmetry, curvature, intersections, and hidden structures that are not visible from a single perspective.
Step 5 — Zoom and Pan
Use the mouse wheel or touch gestures to zoom into specific regions. Zooming allows you to inspect local maxima, local minima, saddle points, discontinuities, oscillations, and singularities. You can also pan across the coordinate system to examine different portions of larger surfaces.
Step 6 — Enable Cross-Section Slicing
Cross-section slicing allows you to cut through a mathematical surface using one of the coordinate planes (X, Y, or Z). Cross sections are widely used in multivariable calculus, structural engineering, finite element analysis, architecture, manufacturing, and medical imaging.
Step 7 — Compare Multiple Equations
The calculator supports multiple graph layers. You can overlay several mathematical surfaces simultaneously to compare functions, identify intersections, visualize optimization problems, and study geometric relationships. Each equation is displayed with a different color for easy interpretation.
Step 8 — Adjust Surface Appearance
Use visualization settings including Smooth Shading, Wireframe Mode, Color Palettes, Surface Opacity, and Lighting Effects. Wireframe mode is particularly useful for studying the underlying mathematical mesh, while smooth shading emphasizes the overall shape of the surface.
Main Features of the 3D Graph Calculator
The NepaCalc 3D Graph Calculator combines interactive visualization with advanced mathematical capabilities.
Interactive 3D Rotation
Rotate graphs freely to inspect every angle of a mathematical surface.
Real-Time Rendering
Every equation updates instantly as you type, powered by WebGL GPU acceleration.
Multiple Graph Layers
Display and compare several mathematical functions simultaneously with distinct colors.
Variable Sliders
Modify constants dynamically without rewriting equations for instant animation.
Cross-Section Analysis
Slice surfaces along the X, Y, or Z axis to study internal geometry.
High-Resolution Surface Mesh
Generate smooth, detailed mathematical surfaces suitable for educational and engineering use.
Built-in Mathematical Presets
Instantly visualize commonly used surfaces without entering equations manually.
Browser-Based Performance
No software installation required. Runs in modern web browsers using GPU-accelerated WebGL.
Mobile Compatible
Works on desktops, tablets, and smartphones with touch-based navigation.
Free to Use
All graphing tools, visualization options, and mathematical presets are available without registration.
Supported Mathematical Expressions
The calculator supports many commonly used mathematical operations, giving users the flexibility to visualize everything from simple classroom examples to advanced engineering equations.
Tips for Better Graph Visualization
- Start with simple equations before experimenting with complex surfaces.
- Rotate the graph frequently to reveal hidden geometry.
- Use cross-section slicing when analyzing complicated models.
- Adjust variable sliders one parameter at a time.
- Increase mesh resolution for smoother surfaces.
- Switch between wireframe and shaded modes depending on your analysis.
- Compare multiple equations to understand mathematical relationships visually.
Mathematical Surface Library for 3D Graphing
One of the biggest advantages of using a 3D Graph Calculator is the ability to visualize mathematical surfaces that are difficult to understand from equations alone.
Whether you are studying multivariable calculus, analytical geometry, engineering mathematics, computer graphics, or physics, plotting these surfaces helps transform abstract equations into interactive three-dimensional models.
The NepaCalc 3D Graph Calculator includes many of the world's most commonly studied mathematical surfaces. Each preset demonstrates unique mathematical properties while serving important roles in science, engineering, architecture, and research.
Wave Surface (Ripples)
The Wave Surface produces circular ripples that spread outward from the origin. It is one of the most recognizable examples used in multivariable calculus because it demonstrates periodic oscillation across two independent variables.
Mathematical Properties
- Continuous surface
- Periodic function
- Circular symmetry
- Oscillating amplitude
- Infinite domain
Applications
- Wave mechanics
- Acoustics
- Electromagnetic waves
- Ocean modelling
- Signal visualization
- Mechanical vibration analysis
Gaussian Surface
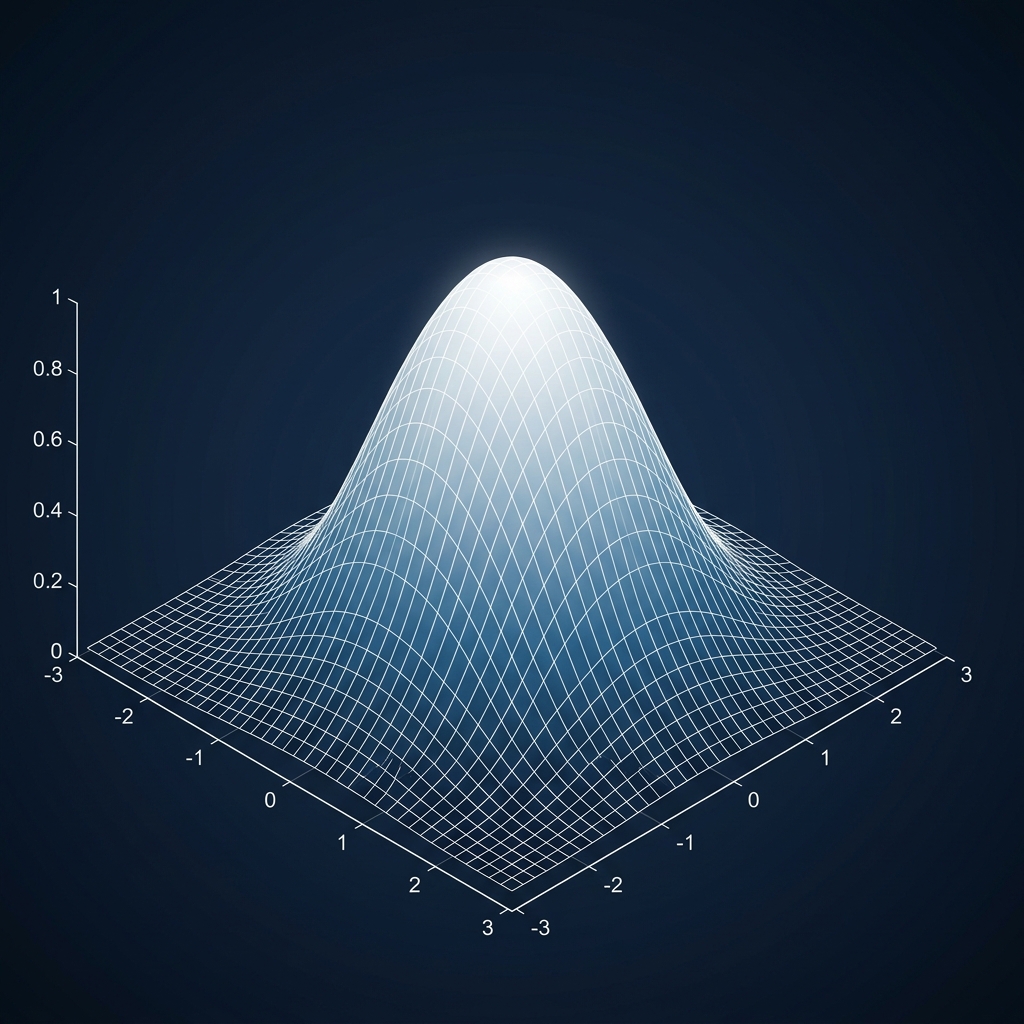
The Gaussian Surface represents the famous bell-shaped distribution used throughout mathematics and statistics. It models how values cluster around a central point while gradually decreasing away from the center.
Mathematical Properties
- Smooth continuous surface
- Single global maximum
- Radial symmetry
- Positive everywhere
- Infinite support
Applications
- Machine learning
- Artificial intelligence
- Data science
- Probability theory
- Statistics
- Heat diffusion
- Image processing
Paraboloid
The paraboloid is one of the most important surfaces in engineering and physics. Unlike a simple parabola, it extends in every horizontal direction, creating a bowl-shaped surface.
Mathematical Properties
- Convex surface
- Single minimum point
- Rotational symmetry
- Quadratic function
Applications
- Satellite dishes
- Radio antennas
- Reflective telescopes
- Solar concentrators
- Car headlights
- Optical engineering
Hyperbolic Paraboloid (Saddle Surface)
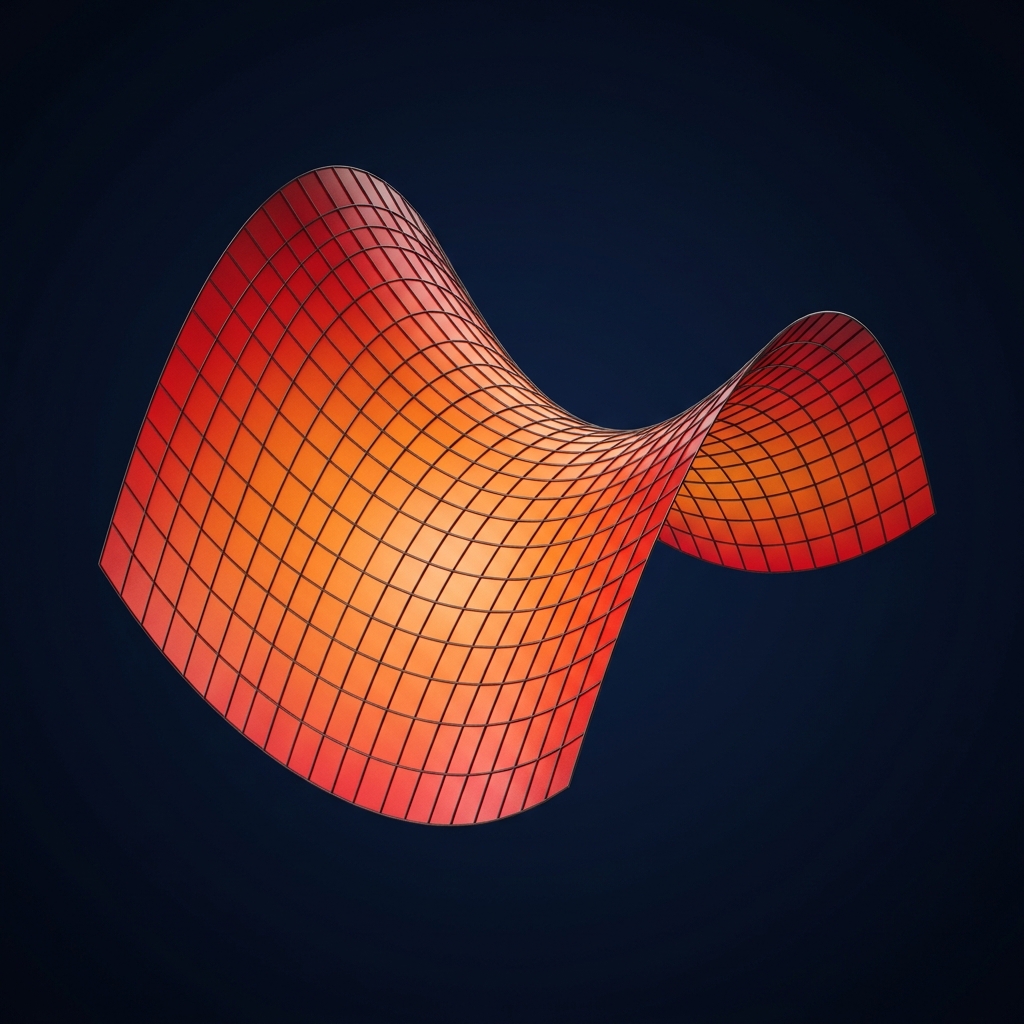
Often called the Saddle Surface, this is one of the most important examples in differential geometry. Unlike the paraboloid, the saddle curves upward in one direction and downward in another.
Mathematical Properties
- Saddle point
- Negative Gaussian curvature
- Hyperbolic geometry
- Two principal curvatures
Applications
- Bridge construction
- Roof structures
- Architectural design
- Structural engineering
- Optimization algorithms
- Surface analysis
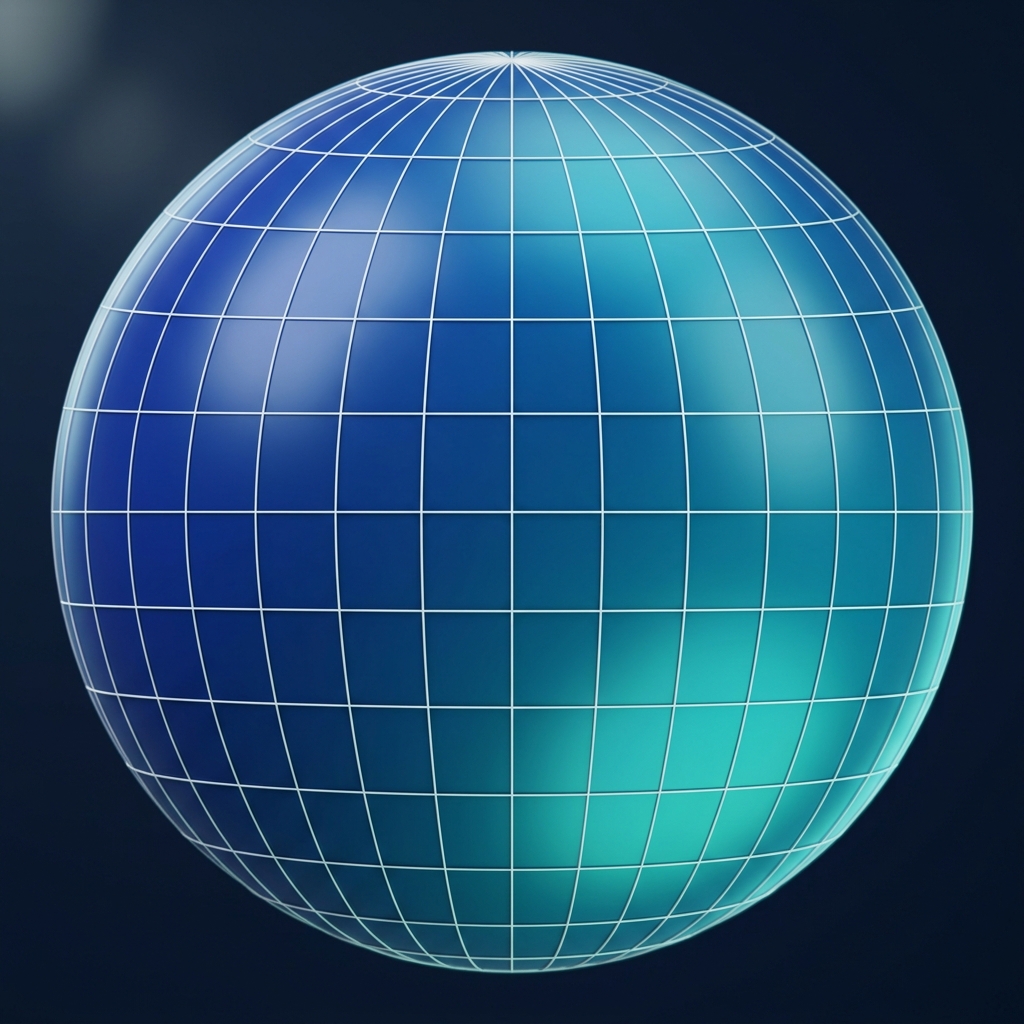
Sphere
The sphere is the most fundamental three-dimensional object in geometry. Every point on its surface is exactly the same distance from the center.
Mathematical Properties
- Constant radius
- Perfect symmetry
- Closed surface
- Constant positive curvature
Applications
- Astronomy
- Planetary modelling
- Computer graphics
- Robotics
- Physics
- Engineering simulations
Cylinder
A cylinder extends infinitely along one axis while maintaining a circular cross-section. It is commonly studied in engineering, manufacturing, and fluid mechanics.
Applications
- Pipes
- Pressure vessels
- Hydraulic systems
- Mechanical shafts
- Storage tanks
- Civil engineering
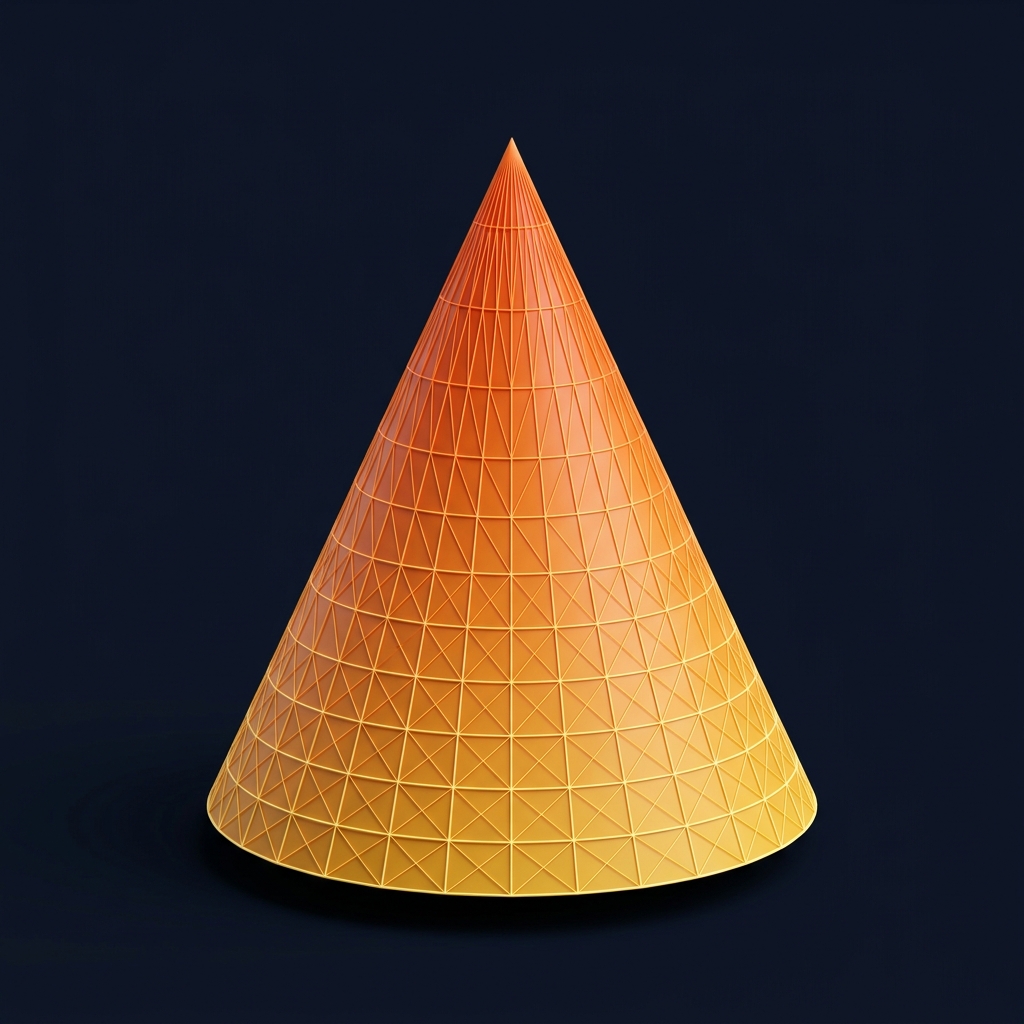
Cone
The cone forms one of the basic geometric primitives used throughout mathematics. Its constant slope makes it ideal for studying gradients and directional derivatives.
Applications
- Optics
- Acoustics
- Mechanical engineering
- Computer graphics
- Architectural modelling
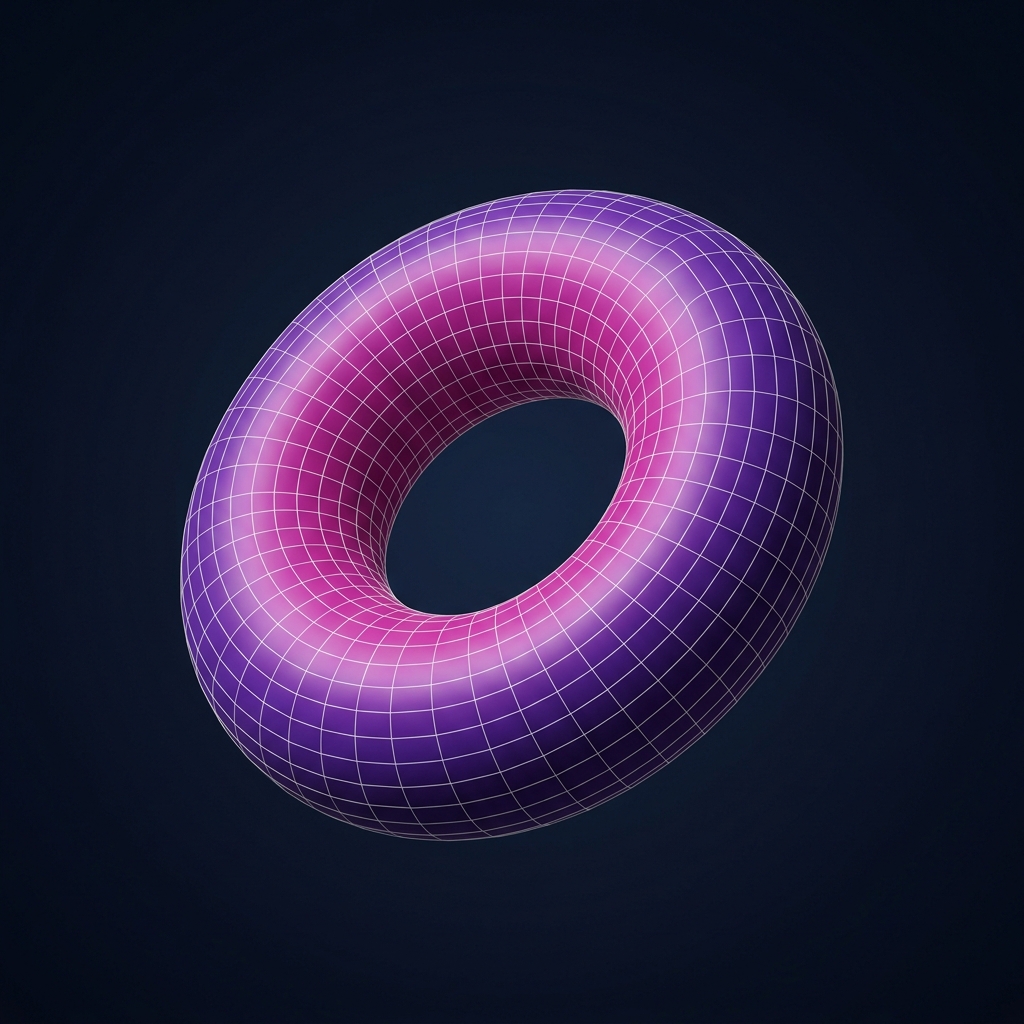
Torus
The torus is commonly known as the doughnut-shaped surface. Despite its simple appearance, it is one of the most important objects in topology.
Mathematical Properties
- Closed surface
- Genus one topology
- Rotational symmetry
- Periodic geometry
Applications
- Plasma reactors
- Fusion research
- Mechanical seals
- Computer graphics
- Topology
- Mathematical modelling
Ellipsoid
An ellipsoid is a stretched sphere with different radii along each axis.
Applications
- Planetary science
- Orbital mechanics
- Medical imaging
- Aerospace engineering
- Navigation systems
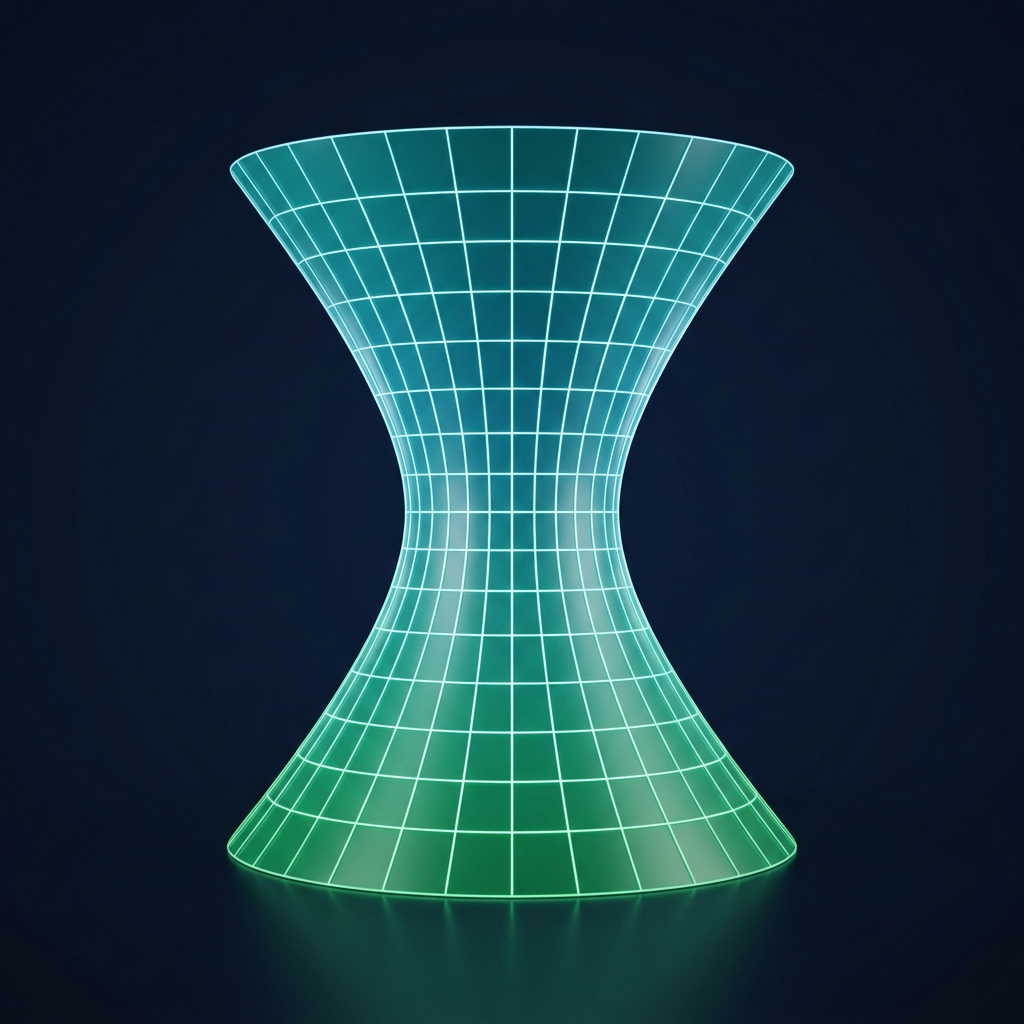
Hyperboloid
Hyperboloids are famous for their elegant curved appearance while still being constructed from straight beams.
Applications
- Cooling towers
- Observation towers
- Architectural landmarks
- Structural optimization
Monkey Saddle
The Monkey Saddle extends the idea of a standard saddle by creating three valleys instead of two. It is widely used in advanced calculus and topology.
Applications
- Critical point analysis
- Higher-order derivatives
- Differential geometry
- Mathematical research
Common 3D Mathematical Surfaces
| Surface | Formula | Common Applications |
|---|---|---|
| Sphere | x²+y²+z²=r² | Geometry, Physics |
| Cylinder | x²+y²=r² | Engineering |
| Cone | z=√(x²+y²) | Architecture |
| Torus | Parametric | CAD, Topology |
| Hyperboloid | Quadratic Surface | Structural Engineering |
| Saddle Surface | Hyperbolic Paraboloid | Optimization |
| Gaussian Surface | e^-(x²+y²) | Statistics |
| Wave Surface | sin(x)cos(y) | Physics |
Create Your Own Mathematical Surface
While the built-in presets demonstrate the most common mathematical models, the NepaCalc 3D Graph Calculator also allows you to create completely custom equations.
Examples include:
Simply enter your equation into the calculator, adjust variables using interactive sliders, and visualize the surface instantly in three-dimensional space. Whether you are exploring classroom mathematics, solving engineering problems, conducting scientific research, or experimenting with advanced multivariable functions, the calculator provides an intuitive way to transform equations into interactive visual models.
Learn 3D Graphing and Mathematical Visualization
What is 3D Mathematical Visualization? 3D mathematical visualization is the process of converting abstract multivariable functions and coordinate equations into interactive three-dimensional geometric surfaces. This graphical representation aids in understanding spatial relationships, gradients, cross-sections, and topological structures critical for engineering, physics, and advanced calculus applications.
A 3D Graph Calculator is more than a plotting tool, it is a visual learning environment for understanding higher-dimensional mathematics.
Instead of interpreting equations only through numbers and symbols, you can instantly transform mathematical expressions into interactive three-dimensional surfaces. This makes abstract concepts easier to understand, analyze, and communicate.
Students, engineers, scientists, architects, researchers, and educators use 3D graphing to study relationships between multiple variables, identify patterns, analyze optimization problems, and visualize complex mathematical models. Whether you are learning multivariable calculus for the first time or building advanced engineering simulations, visualizing equations provides a much deeper understanding than solving them on paper alone.
Understanding the Three-Dimensional Coordinate System
Every graph created inside the NepaCalc 3D Graph Calculator is built on the three-dimensional Cartesian coordinate system. Unlike traditional graphs that only use X and Y axes, three-dimensional mathematics introduces a third independent axis.
X-Axis
Horizontal direction
Y-Axis
Depth direction
Z-Axis
Vertical height
Every point is represented as (x, y, z)
Instead of drawing lines, the calculator creates complete surfaces that extend across the coordinate space. This additional dimension allows mathematicians to visualize relationships that cannot be represented on a flat graph.
Explicit Functions
The majority of mathematical surfaces are represented as explicit functions. For every combination of x and y there exists one corresponding z value.
General form:
z = f(x, y)
Examples include:
- z = x² + y²
- z = sin(x) cos(y)
- z = √(x²+y²)
Explicit functions are computationally efficient and are widely used in:
Implicit Surfaces
Some mathematical objects cannot be written as a simple function of x and y. Instead they are written as an implicit equation.
General form:
f(x, y, z) = 0
Sphere
x²+y²+z²=16
Cylinder
x²+y²=9
Ellipsoid
x²/16+y²/9+z²/4=1
Implicit equations are extremely common in:
The NepaCalc 3D engine visualizes these surfaces automatically using numerical mesh generation.
Parametric Surfaces
Some of the world's most complex mathematical objects are represented parametrically. Instead of solving directly for z, each coordinate is generated using parameters.
General form:
Examples include: Möbius strips, Helicoids, Spirals, Parametric spheres, and Torus parameterizations.
Parametric surfaces are widely used in:
Support for advanced parametric plotting is planned for future NepaCalc releases.
Understanding Surface Curvature
One of the major advantages of a 3D Graph Calculator is that it reveals surface curvature instantly. Different mathematical surfaces bend in different directions.
Positive Curvature
Example: Sphere
Negative Curvature
Example: Hyperbolic paraboloid
Zero Curvature
Example: Plane
Mixed Curvature
Example: Monkey Saddle
Understanding curvature is essential in:
Cross Sections and Slicing
One of the most powerful visualization techniques is slicing. The NepaCalc calculator allows cross-sections along the X, Y, and Z planes.
Cross sections allow users to study:
- Internal geometry
- Symmetry
- Function behavior
- Hidden intersections
Heavily used in:
- CT scanning
- MRI imaging
- Manufacturing
- Engineering design
- Geological modelling
Contour Maps
Every three-dimensional surface can also be represented as contour lines. Instead of displaying the entire surface, contour maps connect locations having equal height.
Contour plots are useful for:
Many engineering disciplines analyze contour plots before studying full 3D models.
Gradient and Slope Visualization
The gradient describes the direction of greatest increase of a function. For functions z = f(x,y), the gradient is denoted ∇f.
Visualizing gradients helps students understand:
Rather than memorizing formulas, interactive visualization makes gradients intuitive.
Partial Derivatives
Unlike single-variable calculus, multivariable functions change in several directions simultaneously. Partial derivatives measure how a surface changes while keeping one variable constant.
These concepts form the foundation of:
Why Visualization Improves Mathematical Understanding
Research consistently shows that visual learning significantly improves comprehension of mathematical concepts. Instead of imagining complex surfaces mentally, students can rotate, zoom, and inspect them from every angle.
Interactive visualization helps users understand:
This makes three-dimensional graphing one of the most effective tools for learning advanced mathematics.
Who Uses 3D Graph Calculators?
Interactive graphing software is widely used across education, engineering, and scientific research. Whether you are studying for an examination or developing real engineering systems, visualizing mathematics provides a deeper understanding than equations alone.
Software Features
Real-World Applications of 3D Graphing
Why is 3D Graphing Important in the Real World? 3D graphing is essential in real-world applications for modeling structural stress in engineering, plotting financial risk terrains, simulating fluid dynamics, and rendering computer graphics. By translating data into 3D space, professionals can predict physical behaviors and optimize designs before real-world implementation.
A 3D Graph Calculator is not only a mathematical visualization tool; it is also an essential platform used across engineering, architecture, physics, computer science, finance, medicine, and scientific research.
Three-dimensional visualization transforms mathematical equations into practical models that help professionals understand complex systems before they are built or tested. From designing aircraft to predicting weather patterns, 3D mathematical models play a critical role in solving real-world problems.
Mechanical Engineering
Mechanical engineers use three-dimensional mathematical surfaces to design, analyze, and optimize mechanical components.
Applications include:
- Stress distribution
- Heat transfer
- Machine components
- Gear geometry
- Pressure vessel analysis
- Vibration analysis
- Fluid flow
- Thermal expansion
Civil Engineering
Modern civil engineering relies heavily on mathematical surface modelling to identify weak regions and structural deformation before construction begins.
Applications include:
- Bridges and dams
- High-rise buildings
- Foundations
- Road alignments
- Drainage systems
- Retaining walls
- Tunnel structures
Architecture
Architects frequently use mathematical surfaces to create innovative building designs, experimenting with curves and structural efficiency.
Examples include:
- Hyperbolic paraboloid roofs
- Shell structures
- Dome geometry
- Free-form facades
- Parametric architecture
- Tensile membrane structures
Aerospace Engineering
Aircraft and spacecraft are designed using sophisticated mathematical models to improve both performance and safety.
Applications include:
- Airfoil surfaces
- Wing profiles
- Rocket trajectories
- Satellite orbits
- Heat shields
- Fuel tank geometry
- Aerodynamic optimization
Computer Graphics
Modern computer graphics rely almost entirely on mathematical surfaces converted into millions of polygons.
Applications include:
- Video game environments
- Character modelling
- Terrain generation
- Procedural animation
- Lighting calculations
- Physics engines
- Surface shading
- Rendering algorithms
Artificial Intelligence
Machine learning algorithms are often visualized as mathematical landscapes, navigating a high-dimensional loss surface.
Applications include:
- Gradient descent
- Local minima
- Saddle points
- Optimization paths
- Decision boundaries
- Cost functions
Other Key Industries
Complete 3D Graph Formula Library
One of the biggest advantages of a professional 3D Graph Calculator is the ability to visualize a wide variety of mathematical surfaces. This calculator supports many of the equations commonly taught in mathematics, engineering, physics, computer graphics, and scientific research.
Basic 3D Functions & Wave Functions
Constant Plane
z = c
Cross sections
Ripple Surface
z = sin(√(x²+y²))
Wave mechanics
Cosine Wave
z = cos(x) cos(y)
Fourier analysis
Mixed Wave
z = sin(x) cos(y)
Interference patterns
Quadric Surfaces
Circular Paraboloid
z = x² + y²
Satellite dishes
Saddle Surface
z = x² − y²
Critical point analysis
Sphere
x² + y² + z² = r²
Astronomy
Circular Cylinder
x² + y² = r²
Pipe systems
Right Circular Cone
z = √(x²+y²)
Optics
Ellipsoid
x²/a² + y²/b² + z²/c² = 1
MRI imaging
Advanced & Engineering Surfaces
Gaussian Bell
z = exp(-(x²+y²))
Statistics
Monkey Saddle
z = x³ − 3xy²
Differential geometry
Exponential Growth
z = e^(x+y)
Population models
One Sheet Hyperboloid
x² + y² − z² = 1
Cooling towers
Polynomial Surface
z = x³+y³
Surface approximation
Rational Function
z = 1/(x²+y²+1)
Numerical analysis
Advanced Concepts in 3D Graphing
As mathematical models become more sophisticated, understanding the underlying concepts becomes just as important as plotting the equations themselves. Professional engineers, mathematicians, physicists, data scientists, and researchers rely on advanced visualization techniques to analyze complex systems that cannot be represented using simple two-dimensional graphs.
Domain and Range
Every mathematical function has a domain (valid x,y inputs) and a range (possible z outputs). Understanding domain restrictions helps prevent undefined mathematical operations while graphing.
Surface Normals
A normal vector is perpendicular to the surface at a specific point. Lighting calculations inside nearly every modern graphics engine depend entirely on accurate surface normals.
Tangent Planes & Level Surfaces
Tangent planes provide local approximations that simplify complicated mathematical surfaces. Level surfaces represent all points having the same function value, like f(x,y,z)=10.
Contour Lines & Gradient Vectors
Contour lines are 2D slices connecting equal heights. The gradient (∇f) points toward the direction of greatest increase, powering optimization algorithms in AI.
Partial & Directional Derivatives
Partial derivatives measure how rapidly the surface changes in x or y directions. Directional derivatives measure the slope along any chosen vector.
Critical Points & Optima
Critical points (where the gradient is zero) may represent local/global maxima, minima, or saddle points, forming the primary objectives of optimization.
Tips for Better 3D Visualization
- Rotate the graph from multiple angles.
- Zoom into important regions.
- Compare multiple equations simultaneously.
- Adjust parameter values using sliders.
- Enable wireframe mode to inspect geometry.
System Requirements
To use the 3D Graph Calculator efficiently:
- Modern Web Browser
- WebGL Enabled
- JavaScript Enabled
- Hardware Acceleration Recommended
- Stable Internet Connection
Browser Compatibility
Best 3D Graph Calculators Compared
| Feature | NepaCalc 3D Grapher | Standard 2D Graphers | Pro Software (e.g. MATLAB) |
|---|---|---|---|
| Browser Based | Yes | Yes | No |
| Installation Required | No | No | Yes (Heavy) |
| Multiple Surfaces | Yes | No | Yes |
| Engineering Presets | Yes | No | Requires Coding |
| Interactive Rotation | Yes | No | Yes |
| Free | Yes | Yes | No (Paid License) |
Today, numerous online tools allow users to visualize three-dimensional mathematical functions. While all of them provide graphing capabilities, each platform focuses on different audiences and use cases. The NepaCalc 3D Graph Calculator combines interactive visualization, educational content, engineering presets, and browser-based performance into a single platform.
NepaCalc vs Desmos 3D Calculator
Desmos excels at interactive plotting and classroom teaching. However, Desmos primarily focuses on graphing itself rather than providing detailed educational explanations or engineering-specific references.
NepaCalc Advantages:
- Complete mathematical reference library
- Engineering-focused presets
- Detailed educational explanations
- Step-by-step learning content
NepaCalc vs GeoGebra 3D
GeoGebra is particularly strong for geometry construction and educational demonstrations.
NepaCalc Advantages:
- Dedicated engineering interface
- Advanced mathematical surface documentation
- Scientific presets
- Calculator-focused workflow
NepaCalc vs Math3D
Math3D is highly capable for university-level mathematics, supporting complex parametric equations and animations.
NepaCalc Advantages:
- Easier interface
- Better educational explanations
- Beginner-friendly documentation
- Formula reference library
NepaCalc vs MATLAB & Mathematica
MATLAB, Mathematica, and Maple are professional engineering and computational mathematics systems used by universities and research institutions.
NepaCalc Advantages:
- Free to use with no installation required
- Browser based with instant visualization
- Simpler interface
- Beginner friendly
Related 3D Graphing Software
Several tools exist for 3D mathematical visualization. Each serves a different audience. Here is a neutral overview of when each tool is most appropriate, and where NepaCalc fits.
Desmos 3D
Best for: High school classroom use and quick 2D/3D plots. Desmos is beginner-friendly with a clean interface. NepaCalc adds engineering presets, surface documentation, and educational reference content that Desmos does not provide.
GeoGebra 3D
Best for: Geometry construction, dynamic proofs, and interactive classroom demonstrations. GeoGebra excels at geometric objects. NepaCalc focuses more on equation-driven surfaces and engineering mathematics.
MATLAB
Best for: Professional engineering simulations, signal processing, and numerical analysis at university and research level. MATLAB requires a license and programming knowledge. NepaCalc is free, browser-based, and requires no coding.
Mathematica (Wolfram)
Best for: Symbolic computation, advanced mathematical research, and publication-quality plots. Mathematica is a paid professional tool. NepaCalc provides fast interactive visualization without the cost or setup.
Wolfram Alpha
Best for: Instant answers and step-by-step computation. Wolfram Alpha generates static graphs. NepaCalc provides interactive, rotatable 3D surfaces that users can explore in real time.
Blender
Best for: 3D modeling, animation, and visual rendering in design and game development. Blender is not a mathematical function plotter. NepaCalc is purpose-built for equation-driven surface visualization and educational mathematics.
NepaCalc 3D Graph Calculator
Best for: Students, engineers, and educators who need a free, browser-based 3D graphing tool with engineering presets, educational surface documentation, and no installation. Pairs well with our Quadratic Equation Solver and Matrix Calculator for a complete mathematical workflow.
3D Graphing Glossary
Understanding common graphing terminology makes it easier to interpret mathematical surfaces and use advanced visualization tools effectively.
Cartesian Coordinates
The standard three-dimensional coordinate system consisting of the x, y, and z axes.
Surface
A two-dimensional mathematical object that exists within three-dimensional space. Examples include spheres, paraboloids, cones, and saddles.
Mesh & Vertex
A collection of small polygons used to approximate a surface. Higher density creates smoother graphs. A vertex is a single coordinate point within the mesh.
Parametric Equation
An equation representing coordinates as functions of parameters. e.g., x=cos(t), y=sin(t), z=t.
Implicit Surface
A surface defined by an equation involving x, y, and z together, like x²+y²+z²=16.
Explicit Function
A function where z depends directly on x and y, like z=x²+y².
Contour Plot & Gradient
A 2D representation using lines of equal height. The gradient is the direction of steepest increase.
Saddle Point
A point where the surface rises in one direction and falls in another.
Gaussian Surface
A bell-shaped surface representing the normal probability distribution.
Hyperbolic Paraboloid
A saddle-shaped surface commonly used in structural engineering and architecture.
Paraboloid & Torus
A paraboloid is curved from quadratic equations (e.g. satellite dishes). A torus is a donut-shape.
Cross Section & Wireframe
A slice to analyze internal geometry. Wireframe displays only edges instead of filled polygons.
Mesh Resolution
The density of the grid used to draw the surface. Higher resolution is smoother but slower.
Polygon Mesh
A collection of vertices, edges, and faces that defines the shape of a 3D object.
Vertex
A specific data point in 3D space defined by (x, y, z) coordinates.
Rendering
The process of generating the final 2D image from the 3D model data.
GPU & WebGL
GPU is the hardware processor; WebGL is the web standard used to access it for fast graphics.
Perspective vs Orthographic Projection
Perspective adds depth (closer objects are larger). Orthographic keeps scale uniform regardless of distance.
Scalar & Vector Fields
A scalar field assigns a single value (like temperature) to every point; a vector field assigns magnitude and direction (like wind).
Frequently Asked Questions (FAQ)
Can I graph implicit equations?▼
Yes. The NepaCalc 3D Graph Calculator supports implicit equations like spheres (e.g. x² + y² + z² = 16) using marching cubes algorithms to render complex closed shapes instantly.
What is the difference between a 2D and 3D graph?▼
A 2D graph plots relationships between two variables (x and y) resulting in curves or lines. A 3D graph adds depth by introducing a third variable (z), mapping out volumetric shapes and continuous surfaces like paraboloids and cylinders.
Can I graph parametric equations?▼
Currently, the calculator natively plots explicit functions z = f(x,y) and standard implicit equations. Full support for parameterized inputs (u,v) is being added in the next feature update.
What is a surface plot?▼
A surface plot connects data points in a 3-dimensional grid to form a solid "skin" or surface over an area. It is widely used in data science, physics, and engineering to visualize how one variable changes in response to two independent inputs.
How do engineers use 3D graph calculators?▼
Engineers use them for finite element analysis, plotting stress distributions across surfaces, visualizing fluid dynamics (pressure maps), finding optimization parameters for machine designs, and determining optimal load paths for structural designs.
Can I plot multiple equations at once?▼
Yes! You can add multiple surfaces by entering additional equations. The grapher will overlay them in the same 3D space, which is perfect for discovering points of intersection between planes, spheres, and cylinders.
Is this calculator free?▼
Yes, our 3D Graph Calculator is 100% free to use. There are no paywalls, hidden fees, or subscription required, making it ideal for students and professionals looking for accessible math tools.
Does it work on mobile devices?▼
Yes, the calculator is fully responsive and supports smartphones and tablets with touch-based rotation and zoom, allowing you to plot surfaces on the go.
Related Mathematical Concepts
Related NepaCalc Calculators
Continue exploring mathematics using our specialized calculators. These tools complement the 3D Graph Calculator and help solve a wide range of mathematical, engineering, and scientific problems.
Who Should Use This Calculator?
Ideal for:
Related Engineering Topics
If you're learning 3D graphing, you may also find these engineering and mathematics tools useful for your calculations:
Continue Learning
Trusted Mathematical References
The following educational references provide authoritative explanations of multivariable calculus, coordinate geometry, engineering mathematics, and scientific visualization concepts discussed throughout this guide.
Continue Exploring Mathematics
Mathematics becomes much easier when you can see it.
The NepaCalc 3D Graph Calculator transforms abstract equations into interactive models that improve understanding, strengthen intuition, and support learning across mathematics, engineering, physics, statistics, computer science, and data visualization.
Whether you are solving homework, preparing for university examinations, teaching a classroom, building engineering models, or conducting research, interactive visualization helps bridge the gap between equations and real-world understanding. Explore more calculators throughout NepaCalc to continue your mathematical journey.